
As a dialectologist, Carlota de Benito Moreno is interested in how linguistic features change over time and space. By plotting her data on a map and combining it with historical data, she can detect diffusion patterns, divides, or clusters. Sometimes, she even discovers something she did not expect.
Tag Archives: Geographic Visualisation
Cholera 1855 in Basel: Between History, Epidemiology and Geographic Visualisation
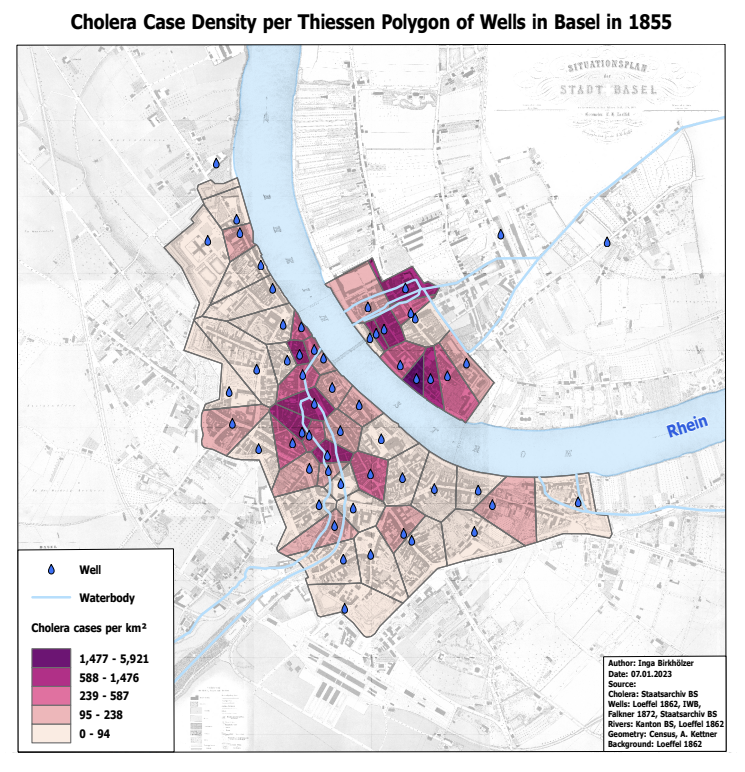
In 1854, Dr. John Snow creates a map of cholera cases in London’s Soho district. He can thus show that the disease is transmitted through contaminated water. In her Master’s thesis, Inga Birkhölzer investigated what can be extracted today from the cholera figures of 1855 in Basel using geographical visualisation.