
Looking back on 2.5 years of the GIS Hub.
Category Archives: Geodata
Geoparsing: from place names in text to a map

In this brief blog post, we’ll explain what geoparsing is and how you can use the Python library developed by a former geography student at UZH.
DIY: Linking R with Web Mapping

If you missed yesterday’s workshop with Stefan from ESRI about the R-ArcGIS Bridge, we are happy to share the workshop material with you. You can read the theory part and do the exercises independently.
“There are hot spots of wrecks in places I did not expect”
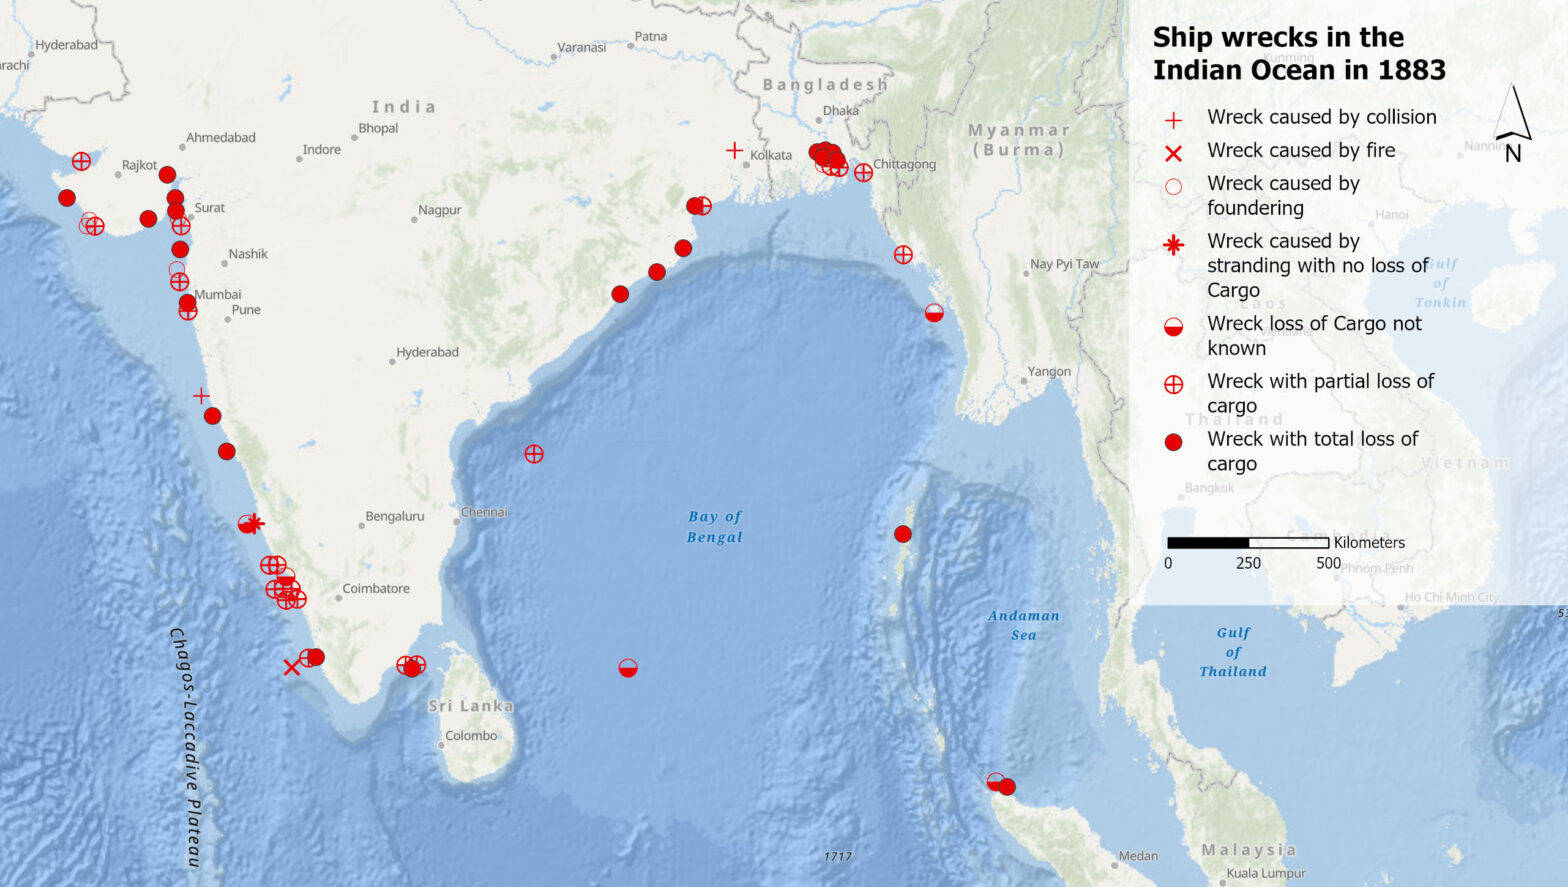
What can shipwrecks of the 19th century in the Indian Ocean tell us about the climate of the past? And what can the records of these wrecks tell us about climate knowledge production? Debjani Bhattacharyya, Professor for the History of the Anthropocene at UZH, explores these questions.
Was sagen Volksmusik-Sendungen über uns aus?

Volksmusik-Sendungen sind mehr als nur Unterhaltung. Was sie über die Gesellschaft, Kultur und Heimat aussagen, dem geht ein SNF-Forschungsprojekt nach. Wir vom GIS Hub durften fürs Projekt eine Karte der Sendeorte erstellen.
Comparing two sets of point data (III)

When we count points of two data sets per cell, we can compare their densities. Generating Chi expectation surfaces allows us to compare actual with expected densities.
Working with point data (II)

This is part II of the point data tutorial for QGIS. It teaches you how to create a grid to calculate a density surface, that is to count the points per grid cell.
Selecting point data in QGIS (I)

Let’s assume: You have imported point data into QGIS and want to analyse it further. This short tutorial shows you step by step how you can filter your dataset based on an attribute or on the spatial location.
How to start a new project in QGIS?
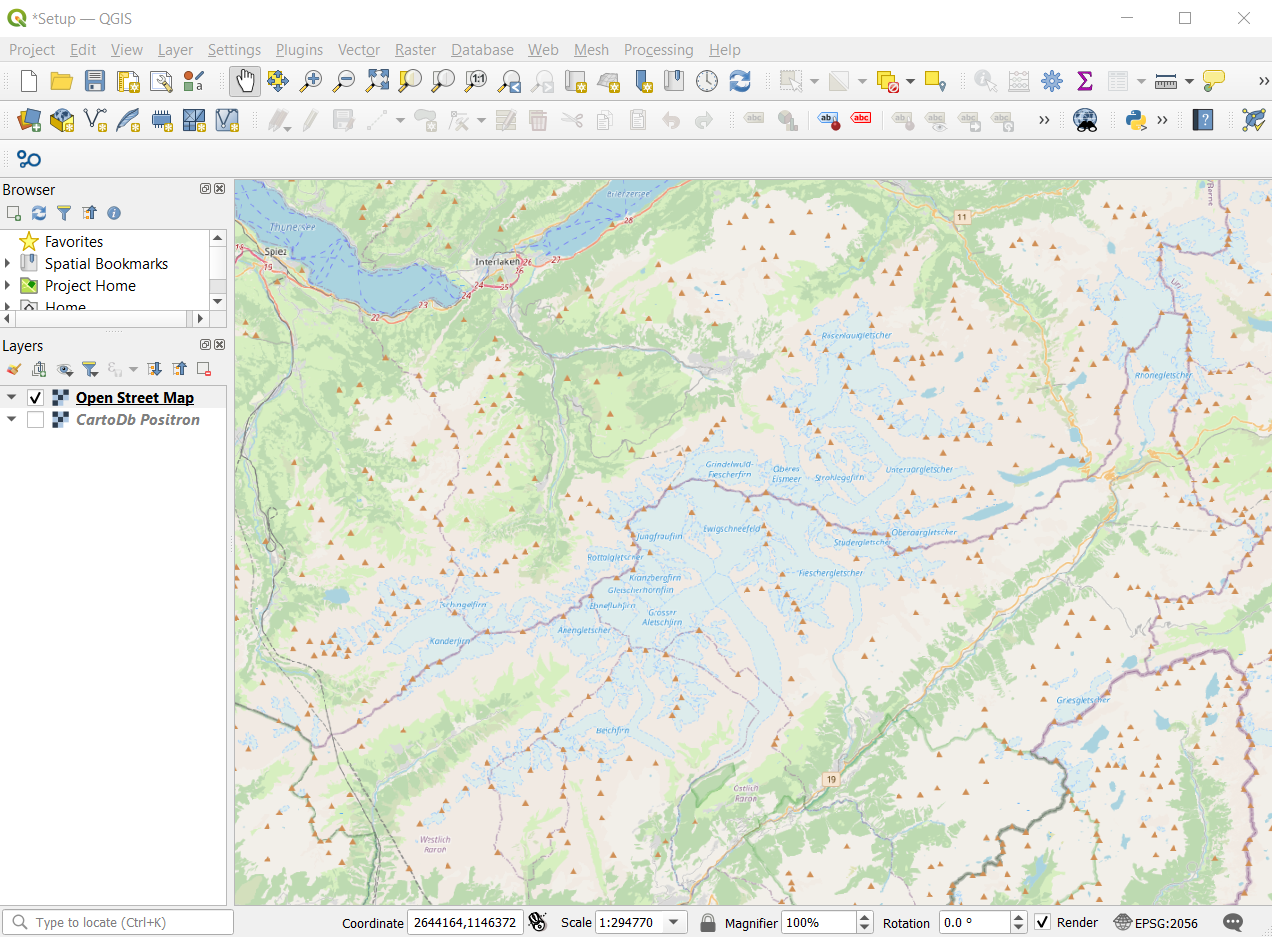
You have spatial data and know what you want to analyse, but how do you start? This short tutorial gets you started and guides you step by step through a project setup.
Using GIS to tackle the SDGs

How do companies, NGOs and public institutions monitor their progress towards the sustainable development goals (SDGs), and how can GIS software contribute? Five speakers provided answers from different perspectives at the event “Using GIS to tackle the SDGs”, organized by the GIS Hub and ESRI Switzerland.